top
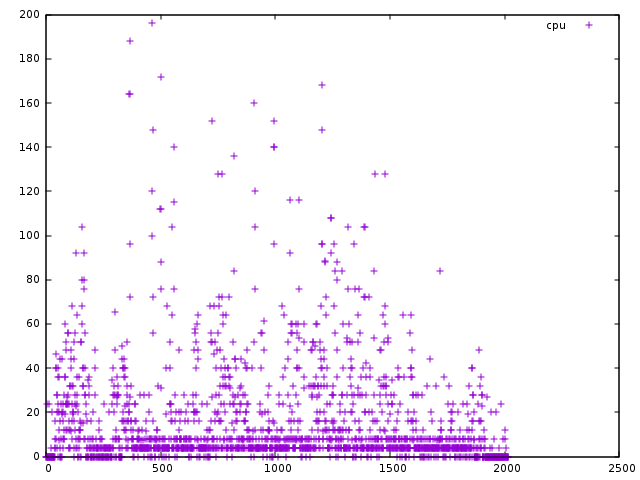
top is a well know command line tool to display process and mem or cpu load statitic. It can be use in batch-mode as a usefull load watcher script.
 free
free let you known memory usage
free
free let you known memory usage
ps
ps extracts processes or/and threads informations
pstack
pstack is command line tool that extract the current running stack of a process
Trace-cmd and Kernelshark
trace-cmd ftrace front-end to extract internal statistics. kernelshark is graphical front end app reading the trace-cmd output.
FlameGraph
FlameGraph is a visualization tool of cpu perf event.
Top example
#1 - interactive mode
top

# some commands :

# k => kill a process
# 1 => display list of cpu
# > => move from left to right the shorting colomn
# < => move from right to left the shorting colomn

# 2 - batch mode
# -b batch mode
# -d delay
# -p pid
top -b -d 1 -p 1234


# 2 - redirect to gnuplot

PID=`pgrep my-process`
top -b -d 0.25 -p $PID | grep --line-buffered $PID | awk '{ print $9 ;fflush();}'  > data.txt
echo "plot '-' using 1 with points title 'cpu' ;" | cat - data.txt | gnuplot -p

free example
freetotal used free shared buffers cached Mem: 16433388 3680308 12753080 18692 325272 1893860 -/+ buffers/cache: 1461176 14972212 Swap: 8265724 0 8265724
ps example:
#list all processes
ps -aef
#list threads with real time priorities attributes
ps -eLo class,rtprio,pid,comm
pstack output
Thread 49 (Thread 0x7f696bd67700 (LWP 2791)):
#0  0x00007f6988287c59 in syscall () from /lib64/libc.so.6
#1  0x00007f6978706397 in epoll_wait () from /usr/lib64/firefox/libxul.so
#2  0x00007f69787061bb in epoll_dispatch () from /usr/lib64/firefox/libxul.so
#3  0x00007f6978709555 in event_base_loop () from /usr/lib64/firefox/libxul.so
#4  0x00007f69786f816e in base::MessagePumpLibevent::Run(base::MessagePump::Delegate*) () from /usr/lib64/firefox/libxul.so
#5  0x00007f69786f9cde in MessageLoop::Run() () from /usr/lib64/firefox/libxul.so
#6  0x00007f6978700948 in base::Thread::ThreadMain() () from /usr/lib64/firefox/libxul.so
#7  0x00007f69786fe647 in ThreadFunc(void*) () from /usr/lib64/firefox/libxul.so
#8  0x00007f6988ff260a in start_thread () from /lib64/libpthread.so.0
#9  0x00007f698828da4d in clone () from /lib64/libc.so.6
Thread 48 (Thread 0x7f6969a63700 (LWP 2792)):
#0  0x00007f6988281fdd in poll () from /lib64/libc.so.6
#1  0x00007f69786986ca in nsNotifyAddrListener::Run() () from /usr/lib64/firefox/libxul.so
#2  0x00007f697850e86c in nsThread::ProcessNextEvent(bool, bool*) () from /usr/lib64/firefox/libxul.so
#3  0x00007f697852a21f in NS_ProcessNextEvent(nsIThread*, bool) () from /usr/lib64/firefox/libxul.so
#4  0x00007f697870e65d in mozilla::ipc::MessagePumpForNonMainThreads::Run(base::MessagePump::Delegate*) () from /usr/lib64/firefox/libxul.so
#5  0x00007f69786f9cde in MessageLoop::Run() () from /usr/lib64/firefox/libxul.so
#6  0x00007f6978511ad8 in nsThread::ThreadFunc(void*) () from /usr/lib64/firefox/libxul.so
#7  0x00007f69752f165b in _pt_root () from /lib64/libnspr4.so
#8  0x00007f6988ff260a in start_thread () from /lib64/libpthread.so.0
#9  0x00007f698828da4d in clone () from /lib64/libc.so.6
trace-cmd example
trace-cmd record -P `pgrep firefox` -e 'sched_*' -- sleep 1
FlameGraph example
# perf tool available on most linux distrib
perf record -F 99 -p `pgrep firefox`  -g -- sleep 60
perf script > out.perf
# FlameGraph perl scripts are available on github https://github.com/brendangregg/FlameGraph
./stackcollapse-perf.pl out.perf >  out.folded
./flamegraph.pl out.folded > out.svg
